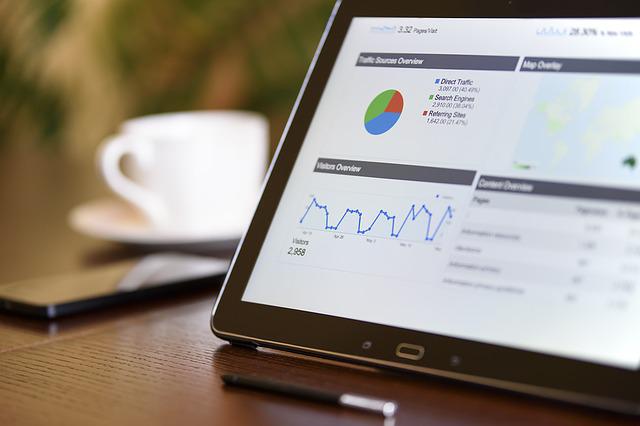
If you’re like most business owners, you are constantly gathering data — whether it’s through surveys, social media analytics, or sales figures. And while raw data is essential for making informed decisions, it cannot be easy to make sense of it without data science consulting and solutions.
That is where data visualization comes in. By representing your business data graphically, you can quickly and easily see patterns and trends that might otherwise hide in a sea of numbers. Data visualization is thus a critical tool for any entrepreneur who wants to make the most informed decisions possible. Here is your chance to explore some of the benefits of this handy tool and how to get started using it yourself.
What Is Data Visualization?
In a world where data is increasing at an ever-increasing rate, the ability to effectively visualize that data is more important than ever. As its name implies, data visualization means the graphical representation of any data, be it survey results or a monthly revenue report. When done well, data visualization can help businesses to see patterns, trends, and correlations that might hide in raw data sets. It can also help to communicate complex information in a way that is easy for non-experts to understand. In short, data visualization is a powerful tool that can make sense of large data sets and communicate complex information clearly and concisely.
There are countless ways to visualize data, but some of the most common methods include charts, tables, graphs, maps, and infographics. Each visualization type has its strengths and weaknesses, so choosing the right one for your data set and your audience is important.
Charts are the #1 way to compare data point by point; data specialists can use them to show trends over time. Tables are useful for large data sets that need to be organized in a specific way, while graphs are the wisest choice to illustrate relationships between different pieces of data. Maps are ideal for showing data with a geographic component, and infographics are perfect for summarizing complex data sets in an easy-to-understand format. Dashboards are another popular data visualization tool that often includes various visualization types. Business doers can design dashboards for specific audiences, so it’s important to consider who will view the dashboard before choosing which visualization type to use.
3 Ways Data Visualization Helps Your Business
Data visualization can be an invaluable tool for your business when done correctly. By using data visualization, you can tell a story with your data that is both clear and compelling. This section will consider three specific ways data visualization benefits business processes and growth.
Successful management of large volumes of complex data
A visual representation of data can help you to see interrelations and understand huge amounts of information at a glance. When dealing with large volumes of complex and heterogeneous data, it is essential to identify patterns and trends quickly. Data visualization provides a way to distill large data sets into easily digestible chunks of information.
More than that, by using visual cues to direct attention, data visualization can help you to see relationships that might not be apparent. As a result, visual representations can make it easier to spot anomalies and outliers. As a result, data visualization can be an invaluable tool for managing large volumes of complex data.
Informed decision-making
In addition to being super effective in processing large volumes of complex data, a visualization is a powerful tool that helps businesses reach informed decisions. By turning complex data sets into easy-to-understand visuals, data visualization provides insights that can guide decisions. That is especially important in today’s data-driven economy, where businesses must rely on data to decide everything from sales to marketing and product development.
From start-ups to Fortune 500 companies, data visualization is helping businesses make better decisions and drive growth. Moreover, data visualization can help businesses better understand consumer behavior and make more informed decisions about pricing and promotions. And because it is such a versatile tool, data visualization can be used by businesses of all sizes and across all industries.
Effective engagement of the target audience
In today’s competitive business landscape, it’s more important than ever to engage your target audience and keep them returning for more. Data visualization is one tool that can help you achieve this goal. By presenting information visually appealingly, data visualization can create an emotional response that helps build a connection with your audience. And when it comes to audience engagement, a connection is key.
Google Analytics is one tool that can help you track your audience engagement and analyze your data visualization tactics to see what’s working and what isn’t. By taking the time to comprehend how data visualization can help your business, knowledge will better equip you to create an effective communication strategy that resonates with your audience.
A Few Data Visualization Tips To Make The Most Of It
Data visualization is a powerful tool for systematizing complex business data, but it can also be daunting to start. Here are the universal hacks to ensure you make the most of them.
- First, choose the right format for your data. Bar charts and line graphs are typically the easiest to understand, but more complex data may require a scatter plot or heat map.
- Second, look for simple and predictable patterns. Data that is too chaotic or unpredictable will be difficult to interpret.
- Third, use intuitive color cues to help convey meaning. For example, warm colors like red can signify danger or warning, while cool colors like blue can represent calm or tranquility.
By following the basics, you can ensure that your data visualization is clear and effective.
Wrapping Up
So there you have it — data visualization in a nutshell. We’ve seen how this tool can help businesses process large volumes of data, make effective decisions, and engage their audiences. And it can start helping you.

